Video Data API
Video QoE analytics, 56 dimensions per session
FastPix Video Data tracks quality of experience across 56 dimensions on every playback session, on 17 player surfaces, in real time. View it in the FastPix dashboard, or pull every session by API into your own dashboard, warehouse, or models.
curl https://api.fastpix.com/v1/data/viewlist -u "<username>:<password>"17 surfaces player integrations tracked 56 dimensions per session (46 + 10 custom) 18 events playback events captured
Trusted by product teams shipping video at scale, from B2B SaaS to OTT and edtech. NVIDIA Inception and Google Cloud partner.
TRUSTED BY PRODUCT TEAMS SHIPPING VIDEO AT SCALE






Use cases
One API for QoE, engagement, and delivery insight.
01
Cut buffering, startup time, and failures.
Watch the QoE families that predict whether viewers stay, buffer ratio, startup time, and playback success, and fix the worst offenders first. Sclera monitors post-migration QoE in real time.
02
See exactly where delivery breaks down.
Break QoE down by country, region, CDN, and ASN to find the precise place playback is slow or failing, instead of guessing from an aggregate number.
03
Build datasets for BI, research, and ML.
Export every session and event to your warehouse and turn raw playback data into features and benchmarks. Data teams and researchers use it for BI, analytics research, and training their own machine-learning models.
How it works
From install to insight in three steps.
TL;DR: 3 steps from install to insight
01
Install the SDK
Drop @fastpix/data (or the React variant) into your app with your env key. It fires on the FastPix Player or any of 17 player surfaces.
02
Set custom dimensions
Tag every session with viewer_user_id and custom_1 to custom_10, so you can slice charts by your own segments later.
03
Watch QoE in real time
Charts segment by any of 56 dimensions the moment sessions play, and raw events stream to your warehouse by webhook.
Dashboard or API
See it in the dashboard, or build your own
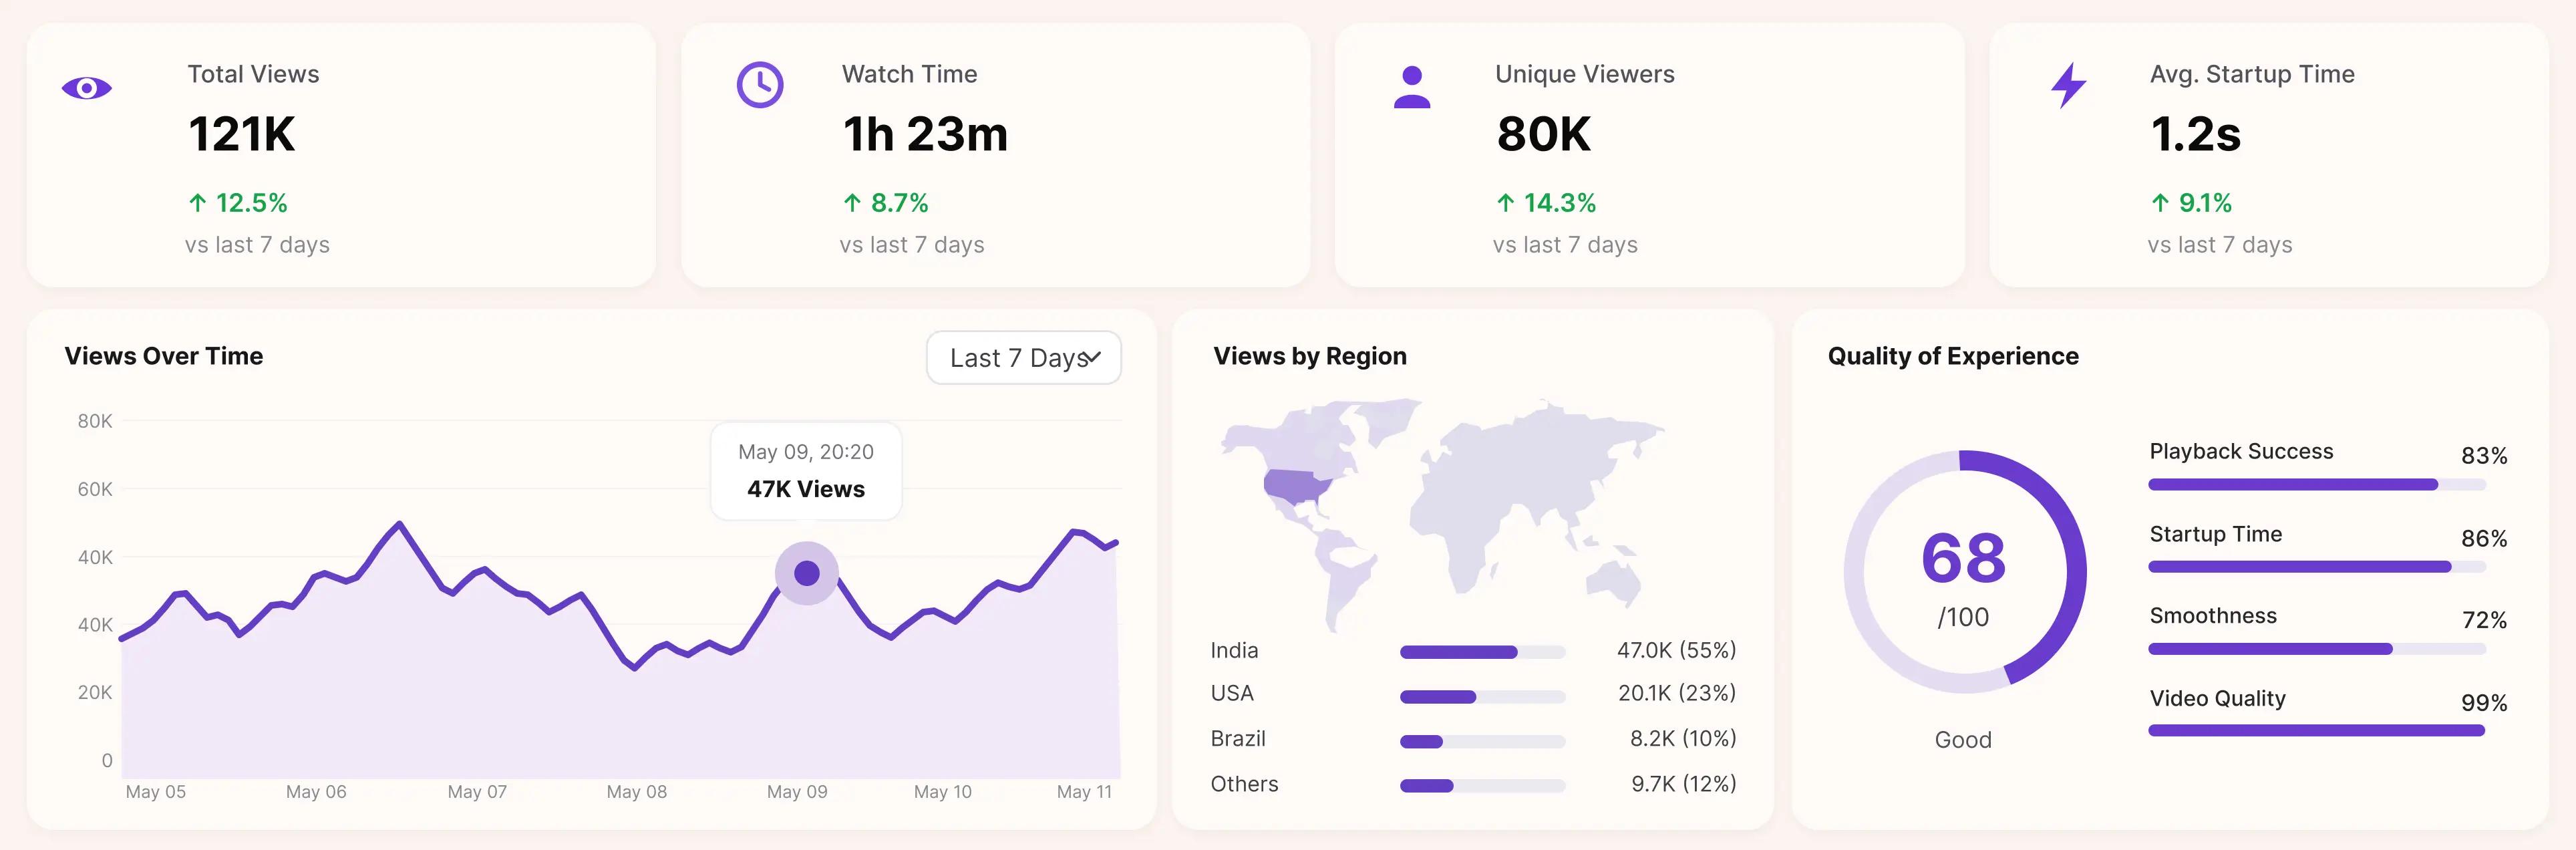
Every metric is visible in the FastPix dashboard the moment a session plays. Prefer your own UI? Call the Video Data API and render the same data in your product, your BI tool, or a dashboard you build.
QoE metrics
QoE scores that predict whether viewers stay.
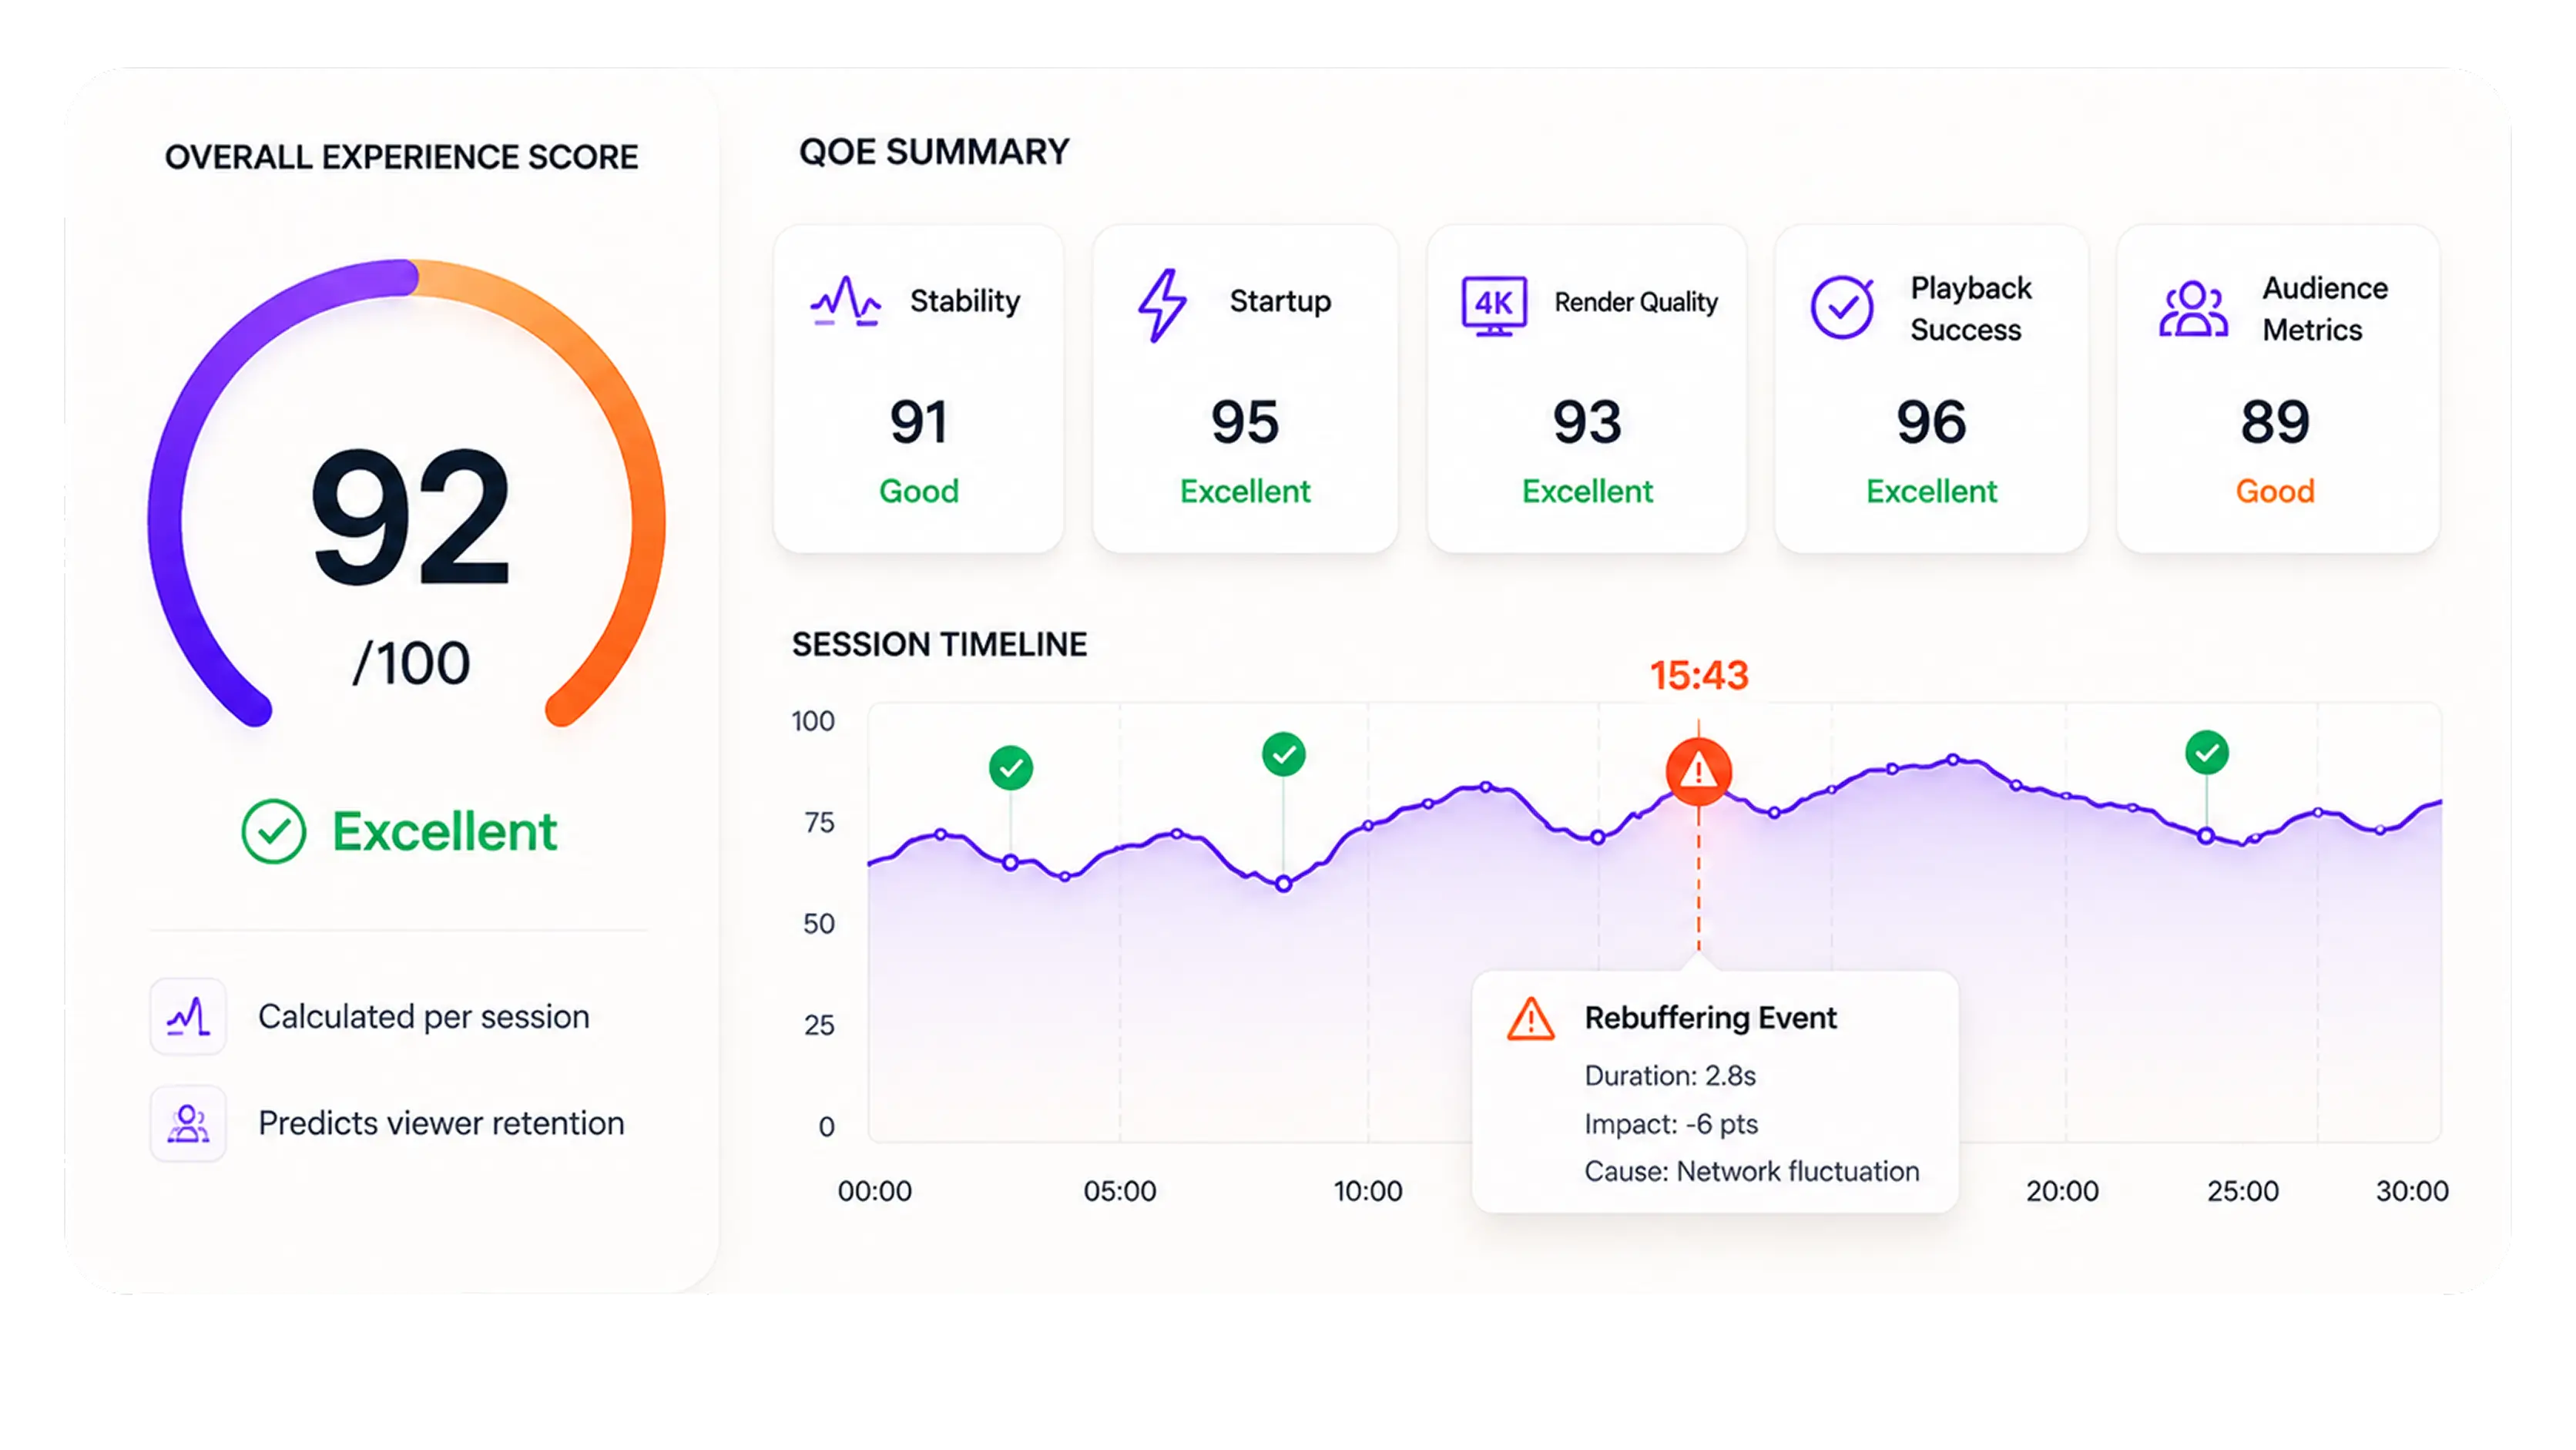
Raw events become scored outcomes. Six metric families distill millions of playback events into one Overall Experience Score per session, and you can drill from a low score straight to the event that caused it.
- Overall Experience Score per session
- Stability: buffer ratio and buffer frequency
- Startup: video startup time and jump latency
- Render quality, playback success, and audience metrics
Today's QoE snapshot
Player-agnostic
Works on any player you already use.
Video Data is not tied to the FastPix Player. One SDK fires the same metrics and dimensions across 17 player surfaces on web, mobile, and smart TV, so you keep your current stack and still get full QoE.
- FastPix Player native, plus 11 third-party player SDKs
- Shaka, HLS.js, Video.js, and DASH.js on web
- ExoPlayer, AVPlayer, Bitmovin, Brightcove, Kaltura, THEOplayer
- Samsung Tizen, LG webOS, Roku, React Native, and Flutter
Segmentation
Slice every session by your own dimensions.
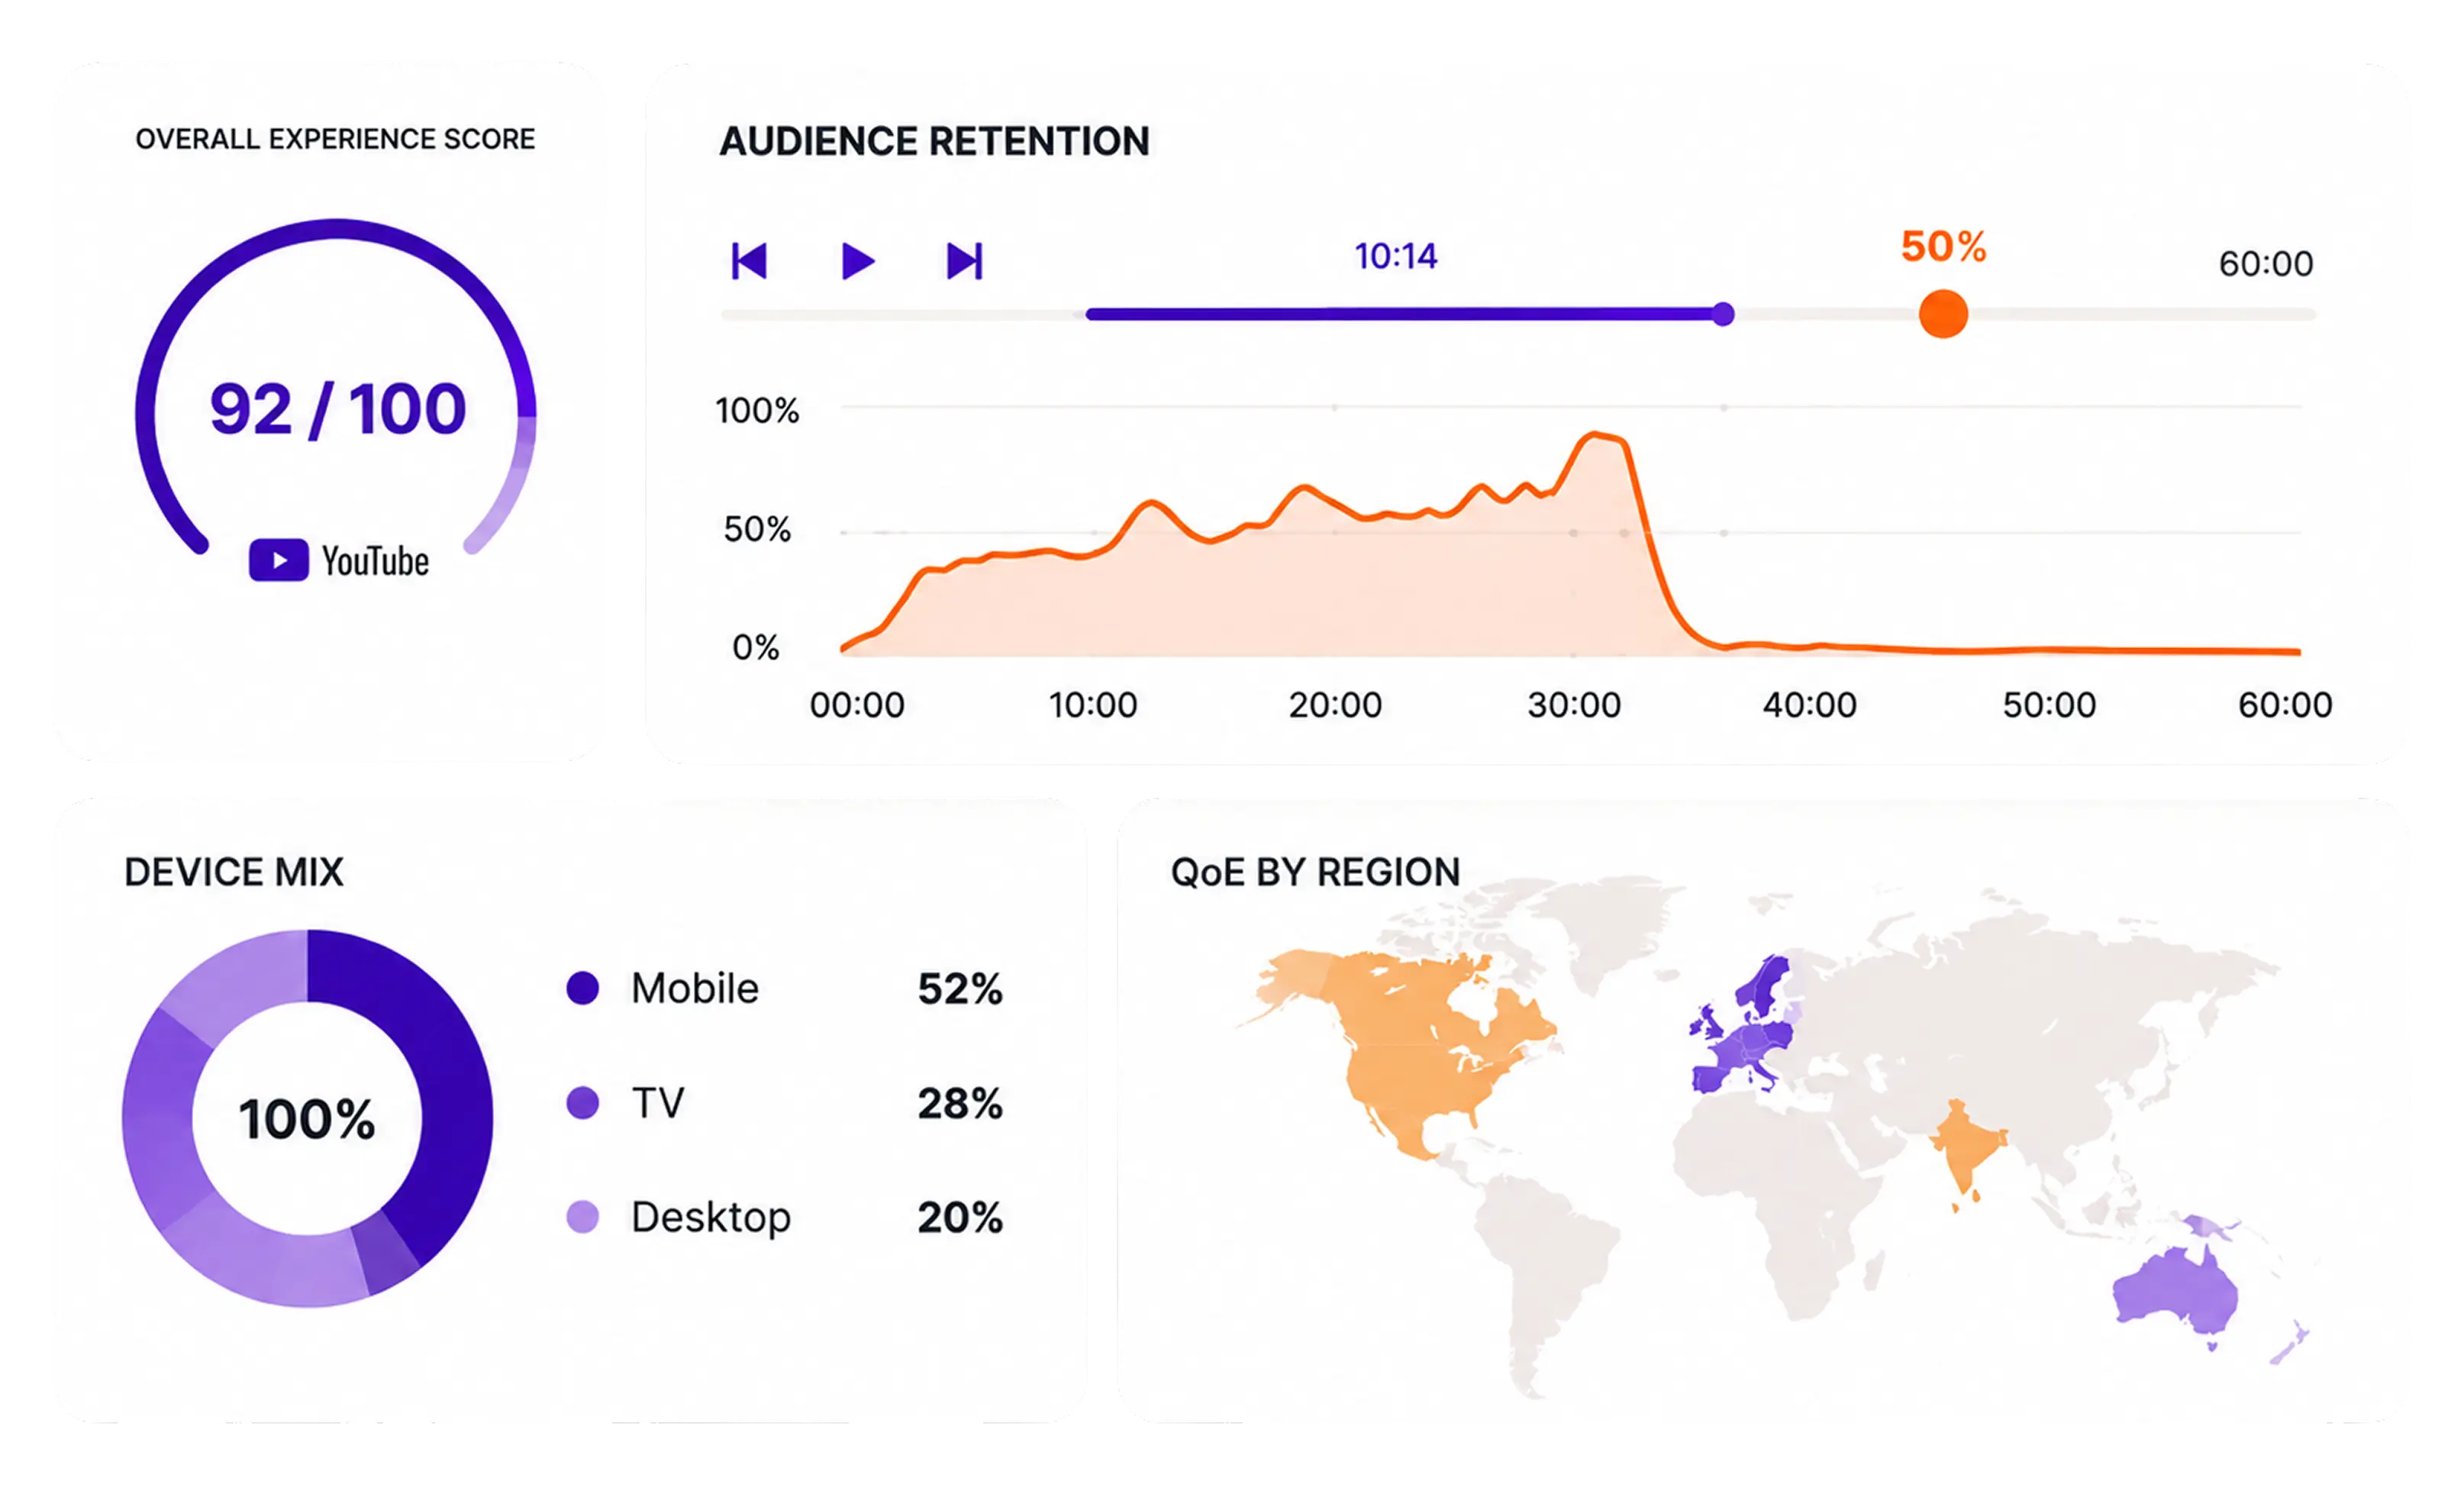
Every session carries 56 dimensions, 46 built-in plus 10 you define. Tag playback with account, plan, episode, or campaign, and segment any chart, including QoE by country, region, CDN, and ASN, to see exactly who is affected.
- 46 built-in dimensions: device, player, network, geo, error flags
- 10 custom dimensions (custom_1 to custom_10)
- Break QoE down by country, region, CDN, and ASN
- Segment retention by account, plan, or cohort
Warehouse and research
Export to your warehouse for session-level insight.
Stream the raw 18-event signal into ClickHouse, Snowflake, BigQuery, Redshift, or Databricks, join it with your business data, and go from a QoE number to the exact cause. The same exported data powers BI, analytics research, and machine-learning pipelines.
- Event-level export to ClickHouse, Snowflake, BigQuery, Redshift, Databricks
- Join playback data with your own business tables
- Power BI dashboards and granular, session-level reporting
- Build datasets for research and ML model training
# viewCompleted webhook payload sent to your endpoint{ "event": "viewCompleted", "view_id": "v_abc123", "viewer_user_id": "user_42", "video_title": "Episode 4", "playing_time_ms": 412000, "buffer_ratio": 0.018, "startup_time_ms": 1180, "custom_1": "account_xyz", "custom_2": "premium"}Alerts
Get alerted before viewers complain.
Set thresholds on any metric or cohort and Video Data fires the moment QoE drops, error rates spike, or a specific segment degrades. Route it to where your team already works.
- Threshold alerts on QoE, error rate, or a cohort
- Fires when a custom-dimension segment degrades
- Route to PagerDuty, Slack, or Opsgenie
- Catch problems before support tickets arrive
Alert firing now
Security, compliance, and partnerships
Customers
“RLTV needed per-account analytics, not aggregate. Custom dimensions tag every playback with account_id and plan_tier. We slice retention curves by customer segment inline.”
Rocketlane product engineering
B2B SaaS customer onboarding (RLTV)
“We monitor every live session and every replay across 4 platforms with one SDK. The QoE composite catches problems before viewers complain.”
Knovo engineering team
Microlearning AI search
56
Dimensions per session
Rocketlane uses custom_1, custom_2
17
Player surfaces tracked
Knovo: web, iOS, Android, Tizen
Real-time
QoE dashboard
Sclera monitors post-AWS-migration
1 SDK
Across all player platforms
Knovo verified
Capabilities that ship
Six key capabilities
Custom dimensions (10 user-defined)
Tag every session by account, plan, episode, campaign, anything. Slice charts by them.
Custom dimensions guideQoE composite scoring
Overall Experience Score per session. Drill from a low score to the failing event in one click.
QoE methodologyReal-time + warehouse export
Dashboard live during a session. Event-level stream to Snowflake / BigQuery / Redshift / Databricks / ClickHouse DB.
Warehouse integrationThird-party player tracking
11 player SDKs tracked beyond FastPix Player. Same dashboard, same dimensions.
Player integration listPer-region QoE breakdown
Country + region + ASN dimensions surface where delivery is slow or unstable.
Regional QoE guideCustom alerts
Alert fires when QoE drops below threshold, error rate spikes, or specific custom-dimension cohort degrades.
Read moreVerified counts, Video Data
17
Player surfaces tracked
Includes 11 third-party SDKs
56
Dimensions per session
46 built-in + 10 customizable
18
Playback events captured
Full state-machine coverage
6
Composite metric families
QoE, Stability, Startup, Render, Playback, Audience
Tech specs
Everything we track. Full reference.
Three layers of measurement. Dimensions (filterable). Playback events (raw signal). Calculated metrics (scored). Same depth as Mux Data. Full reference at fastpix.com/docs
Calculated metrics
Dimensions and filters
Playback events captured
Raw signal collected by the client SDK. The 18 events below are aggregated server-side into the metrics above.
playerReadyviewBeginvariantChangedrequestCompletedplayplayingwaitingbufferingbufferedseekingseekedpulserequestCancelederrorpauserequestFailedloadstartviewCompletedFull reference at fastpix.com/docs/video-data/what-video-data-do-we-capture
Questions developers ask
Video Data questions, answered.
What is video QoE analytics?
Video QoE (quality of experience) analytics measures what playback actually feels like to a viewer: how fast it started, how often it buffered, whether it failed, and how sharp it looked. FastPix scores these into an Overall Experience Score per session so you can track and improve them.
How many dimensions can I track per session?
56 dimensions. 46 built-in (device, browser, OS, player, video metadata, network, geo, error flags). 10 customizable (custom_1 through custom_10).
Which players does Video Data support?
17 player surfaces: FastPix Player, Shaka, HLS.js, Video.js, DASH.js (web), AndroidX Media3, ExoPlayer, Brightcove, Bitmovin, Kaltura, THEOplayer (Android), AVPlayer (iOS), React Native, Better Player (Flutter), Samsung Tizen, LG webOS (Smart TV), Roku streaming device.
What is the 'Overall Experience Score'?
A composite QoE score combining Stability, Startup, Render Quality, and Playback Success into a single number per session. Useful for trend-tracking and per-segment comparison.
Pricing
Per minute streamed, included with delivery.
No platform fee and no per-seat charge. Video Data is included with FastPix delivered minutes. See full pricing.
FREE
100K session plays / month.
$0/ month
Recurring, not trial-shaped. Multi-metric dashboard, view logs, error logs, and 30 days data retention.
- 100K session plays / month
- 56 dimensions per session
- 30 days data retention
GROWTH
1M plays + custom dashboards.
$299/ month
Then $0.50 per 1,000 additional session plays. Full APIs and SDKs to build custom dashboards, 100 days data retention.
- 1M session plays / month
- $0.50 per 1,000 additional plays
- Custom dashboards, 100 days retention
ENTERPRISE
Volume + named-account support.
Custom/ annual
Deeper volume discounts, beta features, consulting + named-account support and SLAs.
- Volume discounts at scale
- Beta features and consulting
- Named-account SLAs
Three ways to get unstuck
Whatever kind of help you need, there is a path.
Engineering support
Talk to a video engineer.
Stuck on an API call, a webhook signature, or a player integration? Reach the engineering team directly. Response within hours, not days.
Contact engineeringIntegration help
Docs, code samples, video tutorials.
Self-serve resources for the most common integrations. Quickstart guides, SDK examples, and detailed playback logs in your dashboard.
Browse the docsSolution architect
Plan the rollout with a human.
New integration, migration off another platform, or a complex multi-tenant build. Book a session with a FastPix solution architect.
Join the Slack communityDeveloper resources
Everything you need to start building.
Five-minute quick-start
Sign up, hit the endpoint, ship.
Quick-start guideFull API reference
Every endpoint, every parameter, every response.
API referenceWebhook reference
Every event FastPix emits, with sample payloads.
WebhooksCode samples
Sample apps and SDK examples on GitHub.
GitHubSlack community
Talk to FastPix engineers and other developers.
Join SlackService status
Real-time uptime and incident reports.
Status page