If you're building a video product, one question eventually lands on your desk:
Why are viewers leaving?
At first glance, this sounds like a content problem.
- Maybe the introduction was too long.
- Maybe the topic wasn't engaging.
- Maybe the video simply wasn't relevant.
But after running a few investigations, you quickly discover that viewers don't always leave because of the content.
Sometimes they leave because:
- playback took too long to start
- video quality dropped unexpectedly
- buffering interrupted the experience
- network conditions degraded playback
- a specific ISP delivered poor performance
The challenge is that most analytics dashboards tell you what happened, but not necessarily why it happened.
In this article, we'll use:
- FastPix Video Data APIs for viewer and playback analytics
- ClickHouse for custom analysis
- Sample application telemetry to enrich the investigation
By the end, you'll have a workflow that helps answer:
Are viewers dropping off because of the content or because of the playback experience?
What You'll Build
We'll combine:
FastPix Video Data
FastPix captures detailed playback and Quality of Experience (QoE) metrics including:
- watch time
- buffering
- startup time
- bitrate
- playback errors
- QoE scores
- network provider information
These APIs allow you to retrieve both raw and aggregated viewer analytics.
ClickHouse
We'll use ClickHouse to:
- store FastPix metrics
- combine them with application data
- perform custom investigations
- identify patterns hidden from dashboards
Application Telemetry
Let's assume your application also collects information such as:
| Metric | Description |
|---|---|
| session_id | User session identifier |
| user_tier | Free or paid user |
| feature_used | Feature accessed before playback |
| page_load_time | Time to load page |
| api_latency | Backend latency |
| recommendation_source | Search, recommendation, direct link |
This helps connect viewer behavior with application performance.
Step 1: Pull Time-Series Data from FastPix
FastPix provides a dedicated endpoint for retrieving metrics over time.
The API returns:
- intervalTime
- metricValue
- numberOfViews
allowing you to track how playback metrics evolve over time.
Useful metrics include:
- Views
- Watch Time
- QoE
- Startup Time
- Buffer Ratio
Documentation:
FastPix Get Timeseries Data API
FastPix recommends using time-series data when you want to identify trends, peak engagement periods, and playback quality changes over time.
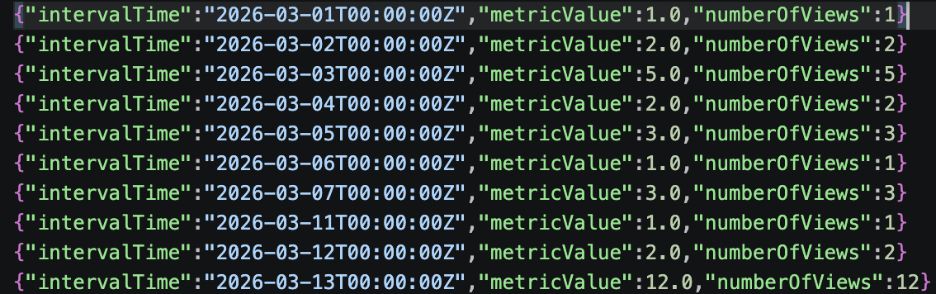
Example response:
1{
2"intervalTime": "2026-05-14T12:00:00Z",
3"metricValue": 603,
4"numberOfViews": 603
5}
Step 2: Load the Data into ClickHouse
Create a table for FastPix metrics:
1CREATE TABLE fastpix
2(
3intervalTime DateTime,
4metricValue Float64,
5numberOfViews UInt64
6)
7ENGINE = MergeTree
8ORDER BY intervalTime;
Import the API response into ClickHouse.
After loading the data, you might see something like:
| Hour | Views |
|---|---|
| 07:00 | 90 |
| 08:00 | 175 |
| 09:00 | 105 |
| 10:00 | 603 |
Immediately, we can identify peak viewing periods.
But we still don't know why viewers may be leaving.
Step 3: Create Sample Application Data
Let's create a simple dataset representing application telemetry.
1CREATE TABLE Appdata
2(
3created_at String,
4api_latency UInt32,
5page_load_time UInt32,
6user_tier String,
7recommendation_source String
8)
9ENGINE = MergeTree
10ORDER BY created_at;
11
12Sample data:
13
14INSERT INTO Appdata VALUES
15('2026-05-14T07:15:00Z',120,900,'free','search'),
16('2026-05-14T08:20:00Z',150,850,'free','recommendation'),
17('2026-05-14T09:30:00Z',110,800,'paid','direct'),
18('2026-05-14T12:10:00Z',850,2400,'free','recommendation');
Notice that at noon:
- API latency jumps
- page load times increase
This is exactly the kind of signal that can explain viewer dissatisfaction.
Note: Make sure the timeseries data is in the JSONEachrow format.
Step 4: Use FastPix Playback Data
Your FastPix dataset already contains powerful playback metrics.
Some particularly useful columns include:
1watch_time
2buffer_ratio
3quality_of_experience_score
4video_startup_time
5average_bitrate
6avg_request_latency
7avg_downscaling
8asn_name
These metrics allow you to investigate playback quality directly.
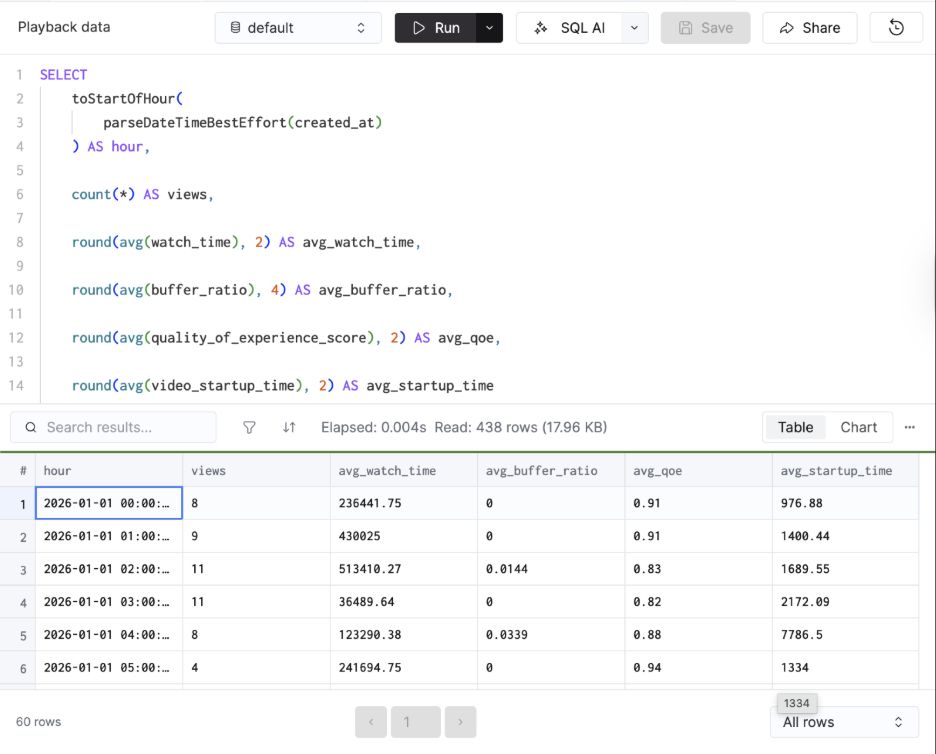
Step 5: Investigate Viewer Experience
A great starting query is:
1SELECT
2toStartOfHour(
3parseDateTimeBestEffort(created_at)
4) AS hour,
5
6count(*) AS views,
7
8round(avg(watch_time), 2) AS avg_watch_time,
9
10round(avg(buffer_ratio), 4) AS avg_buffer_ratio,
11
12round(avg(quality_of_experience_score), 2) AS avg_qoe,
13
14round(avg(video_startup_time), 2) AS avg_startup_time
15
16FROM Appdata
17
18GROUP BY hour
19
20ORDER BY hour;
This gives you a timeline of:
- views
- watch time
- buffering
- startup performance
- QoE
Now we're beginning to see what viewers experienced.
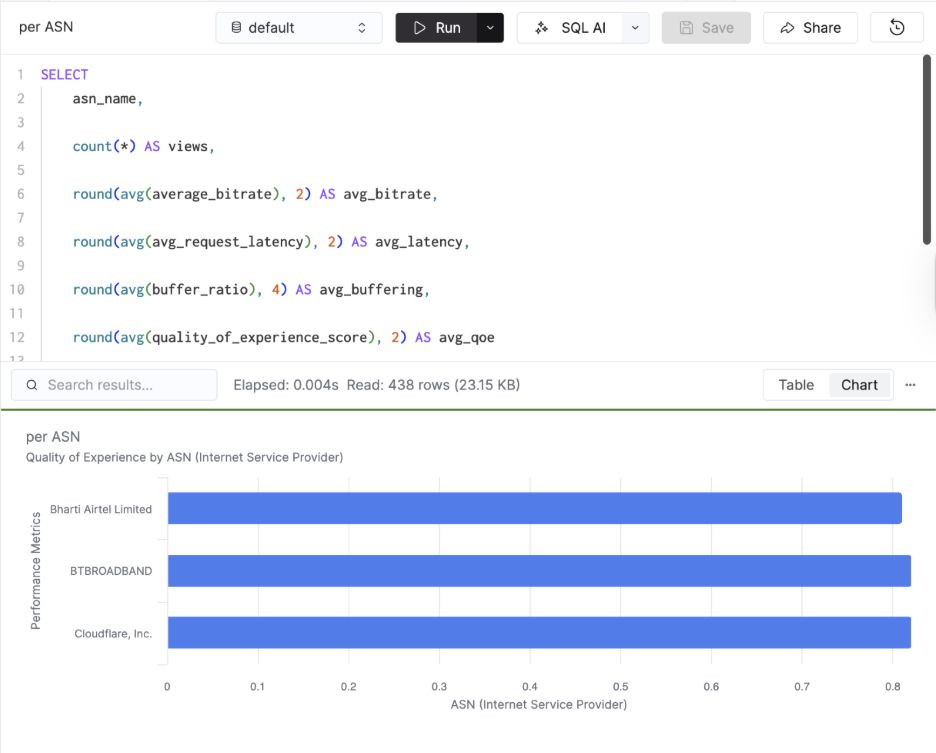
Step 6: Find Network Providers Causing Poor Experiences
One of the most valuable dimensions in the FastPix dataset is:
asn_name
which represents the viewer's network provider.
1SELECT
2asn_name,
3
4count(*) AS views,
5
6round(avg(average_bitrate), 2) AS avg_bitrate,
7
8round(avg(avg_request_latency), 2) AS avg_latency,
9
10round(avg(buffer_ratio), 4) AS avg_buffering,
11
12round(avg(quality_of_experience_score), 2) AS avg_qoe
13
14FROM Appdata
15
16GROUP BY asn_name
17
18HAVING views > 10
19
20ORDER BY avg_qoe ASC;
This helps answer:
Are viewers on a particular ISP having a worse experience?
This is incredibly useful for:
- video engineers
- platform teams
- customer success teams
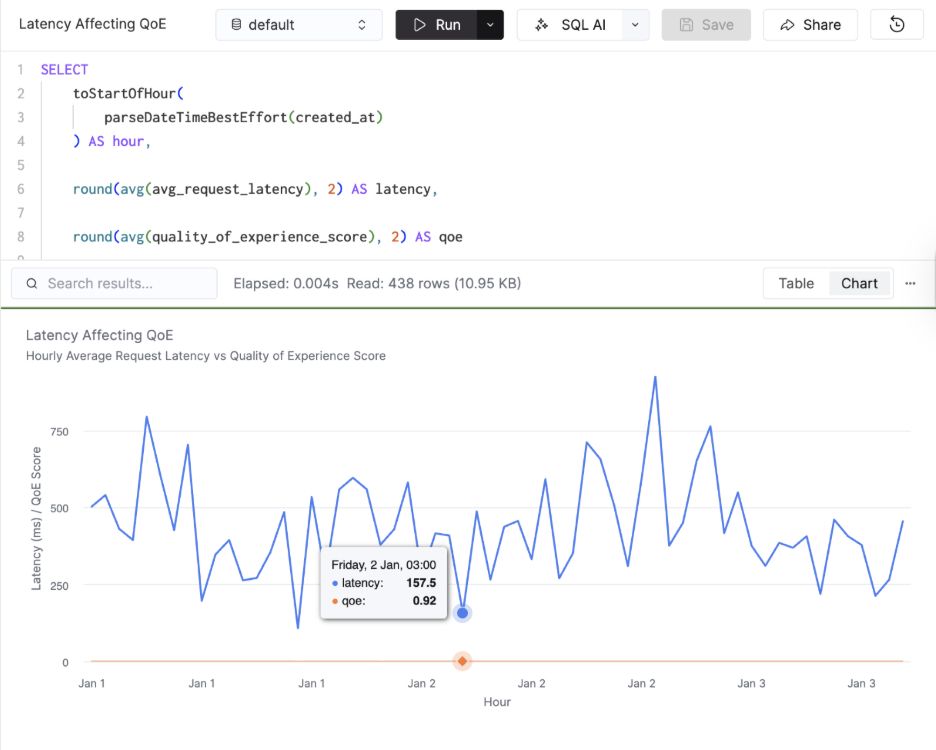
Step 7: Is Latency Affecting QoE?
Next, let's compare latency and playback quality.
1SELECT
2toStartOfHour(
3parseDateTimeBestEffort(created_at)
4) AS hour,
5
6round(avg(avg_request_latency), 2) AS latency,
7
8round(avg(quality_of_experience_score), 2) AS qoe
9
10FROM Appdata
11
12GROUP BY hour
13
14ORDER BY hour;
If QoE drops whenever latency rises, you've found a strong signal that infrastructure performance is impacting viewers.
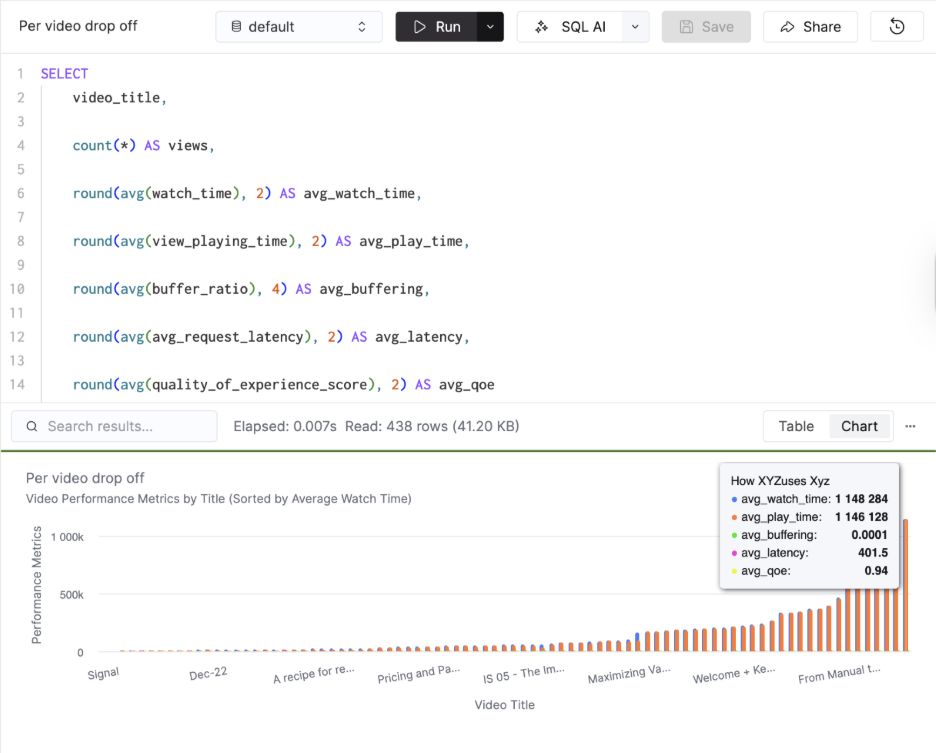
Step 8: Identify Videos with Potential Drop-Off Problems
Now we can investigate viewer engagement directly.
1SELECT
2video_title,
3
4count(*) AS views,
5
6round(avg(watch_time), 2) AS avg_watch_time,
7
8round(avg(view_playing_time), 2) AS avg_play_time,
9
10round(avg(buffer_ratio), 4) AS avg_buffering,
11
12round(avg(avg_request_latency), 2) AS avg_latency,
13
14round(avg(quality_of_experience_score), 2) AS avg_qoe
15
16FROM Appdata
17
18GROUP BY video_title
19
20ORDER BY avg_watch_time ASC;
Example result:
| Video | Avg Watch Time | Buffering | QoE |
|---|---|---|---|
| Product Demo A | 35 sec | 0.12 | 62 |
| Product Demo B | 310 sec | 0.01 | 95 |
Now the investigation becomes interesting.
For Product Demo A:
- watch time is low
- buffering is high
- QoE is poor
This suggests the issue may not be the content itself.
The playback experience could be driving viewers away.
Who Should Use FastPix vs ClickHouse?
A common question is:
Why not just use the FastPix dashboard?
The answer is simple.
| FastPix | ClickHouse |
|---|---|
| Shows what happened | Helps explain why |
| Pre-built analytics | Custom investigations |
| Viewer behavior | Cross-system analysis |
| QoE reporting | Root-cause analysis |
FastPix helps answer:
What are viewers experiencing?
ClickHouse helps answer:
Why are they experiencing it?
Together they provide a much more complete picture.
Final Thoughts
Viewer drop-offs are rarely caused by a single factor.
A viewer may leave because:
- the content isn't engaging
- startup times are too high
- buffering interrupts playback
- network conditions degrade quality
- backend latency impacts delivery
FastPix Video Data APIs provide the playback and QoE signals needed to understand viewer experience, while ClickHouse gives you the flexibility to perform deeper investigations and combine video analytics with application telemetry.
The result is a workflow that moves beyond simple reporting and helps answer the question every video team eventually asks:
Why did viewers leave?