

Render quality metrics
Render Quality Metrics are a set of measurements that assess the quality of video streams from the viewer’s perspective. These metrics include the Render Quality Score, which quantifies the perceived visual quality of a video by averaging the quality ratings of individual views which reflects the proportion of views rated at the highest quality level.
Additional metrics such as Upscale Percentage and Downscale Percentage measure the frequency of resolution adjustments made by the video player, while Max Upscaling and Max Downscaling indicate the highest resolutions achieved during these adjustments. Together, these metrics provide valuable insights into how well video content meets viewer expectations for clarity and detail, ultimately influencing viewer satisfaction and engagement.
1. Render Quality Score
2. Upscale Percentage
3. Downscale Percentage
4. Max Upscaling
5. Max Downscaling
6. Average Bitrate
7. Live Stream Latency
1. Render Quality Score
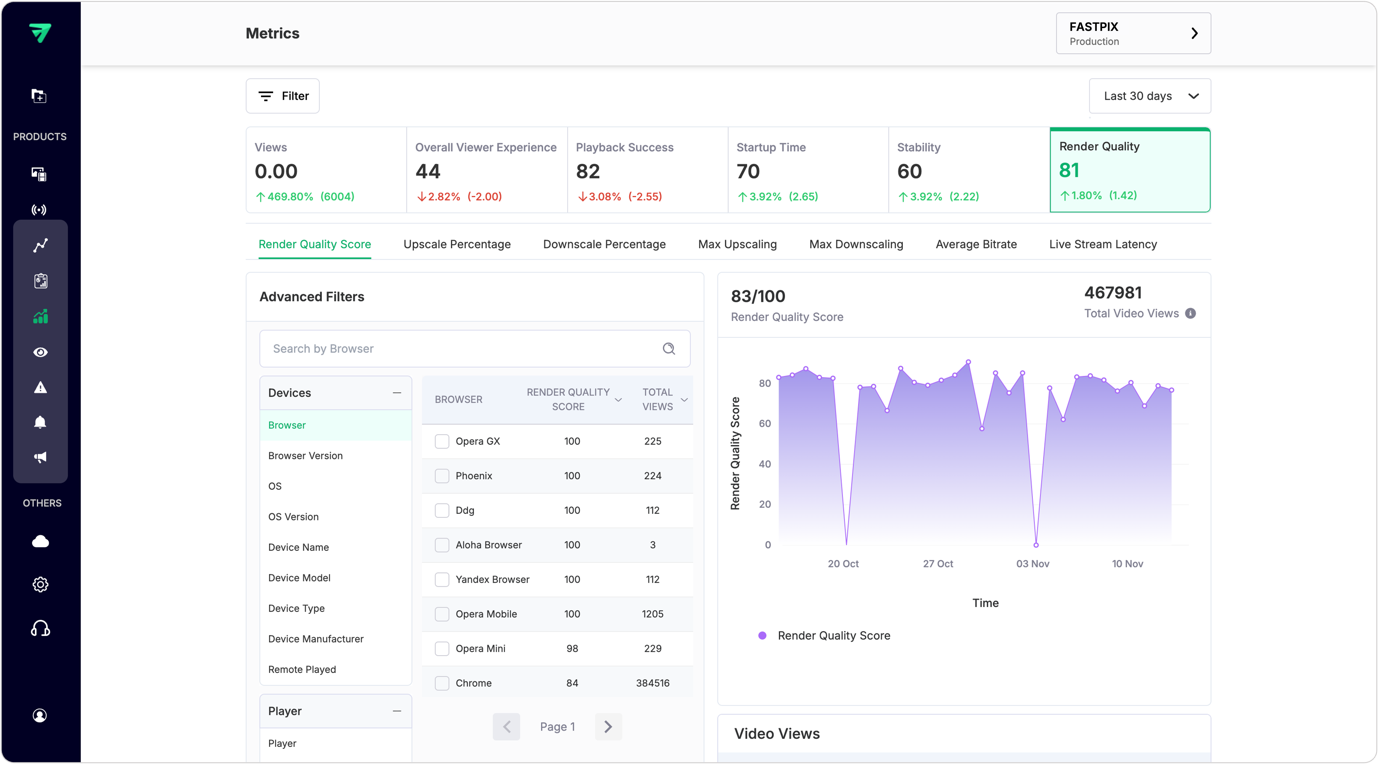
The Render Quality Score quantifies the perceived quality of the video stream as experienced by viewers. It is calculated by averaging the Render Quality Scores of each video view, which are determined based on the Video Quality Percentage. This percentage is derived by dividing the number of video views with a Render Quality Score of 100 by the total number of video views.
Importance
The Render Quality Score provides critical insights into the visual quality of streamed content. A higher score indicates that a greater percentage of views are perceived as high quality, reflecting positively on the content delivery system. Understanding this metric helps content providers assess viewer satisfaction and identify areas for improvement in video quality.
How to use Render Quality Score
- Monitor changes in the score over time to evaluate the impact of quality improvements or changes in encoding settings.
- Analyze viewer feedback in conjunction with this score to understand perceptions of video quality.
- Use insights from this metric to inform decisions about content encoding and delivery strategies.
API usage
Use the List overall values API to retrieve overall values for Render Quality Score. You need to pass render_quality_score as the metricId along with other query parameters to receive the response.
2. Upscale Percentage
The Upscale Percentage measures the percentage of time that the video player upscales the video resolution to match the device’s screen resolution. Upscaling occurs when a lower-resolution video is displayed at a higher resolution.
Importance
Understanding the Upscale Percentage is essential for assessing how often viewers experience upscaled content, which can affect perceived video quality. Frequent upscaling may lead to a decline in visual clarity, impacting viewer satisfaction.
How to use Upscale Percentage metric
- Track this metric across different videos and devices to identify trends in upscaling behavior.
- Analyze correlations between high upscale percentages and viewer feedback regarding video quality.
- Use findings to optimize content delivery strategies, ensuring that appropriate resolutions are used for various devices.
API usage
Use the List overall values API to retrieve overall values for Upscale Percentage. You need to pass avg_upscaling as the metricId along with other query parameters to receive the response.
3. Downscale Percentage
The Downscale Percentage quantifies the percentage of time that the video player downscales the video resolution to fit the device’s screen resolution. Downscaling occurs when a higher-resolution video is displayed at a lower resolution.
Importance
Monitoring Downscale Percentage helps assess how often viewers receive lower-quality visuals due to downscaling. This metric is important for understanding how well content matches viewer device capabilities.
How to use Downscale Percentage metric
- Analyze this metric in conjunction with Upscale Percentage to get a complete picture of resolution adjustments during playback.
- Investigate instances where downscaling occurs frequently and consider optimizing content encoding for better alignment with viewer devices.
- Use insights from this metric to enhance overall viewing experiences by ensuring optimal resolutions are delivered.
API usage
Use the List overall values API to retrieve overall values for Downscale Percentage. You need to pass avg_downscaling as the metricId along with other query parameters to receive the response.
4. Max Upscaling
Max Upscaling measures the maximum resolution to which the video player upscales a video in order to match the device’s screen resolution.
Importance
This metric provides insights into how high viewers can expect their videos to be displayed when upscaled. Understanding Max Upscaling helps identify potential issues with visual quality when lower-resolution content is played on high-resolution screens.
How to use Max Upscaling metric
- Monitor this metric alongside Upscale Percentage to assess how often videos reach their maximum upscaled resolutions.
- Analyze viewer feedback related to visual clarity and satisfaction when videos are displayed at maximum upscale resolutions.
- Use findings from this metric to inform encoding decisions that optimize visual quality for high-resolution displays.
API usage
Use the List overall values API to retrieve overall values for Max Upscaling. You need to pass max_upscaling as the metricId along with other query parameters to receive the response.
5. Max Downscaling
Max Downscaling quantifies the maximum resolution to which the video player downscales a video to fit the device’s screen resolution.
Importance
Understanding Max Downscaling is essential for assessing how much visual quality may be lost when high-resolution videos are displayed on lower-resolution screens. This metric helps ensure that viewers receive an optimal viewing experience regardless of their device capabilities.
How to use Max Downscaling metric
- Track this metric alongside Downscale Percentage for a comprehensive understanding of resolution adjustments during playback.
- Investigate correlations between frequent downscaling events and viewer satisfaction metrics.
- Optimize content delivery strategies based on insights from this metric to enhance overall viewing experiences.
API usage
Use the List overall values API to retrieve overall values for Max Downscaling. You need to pass max_downscaling as the metricId along with other query parameters to receive the response.
6. Average Bitrate
The Average Bitrate measures the average number of bits per second that a video stream delivers during playback. This metric provides insights into the overall data rate used for streaming content.
Importance
Monitoring Average Bitrate is crucial for understanding data consumption and ensuring that streams maintain adequate quality without excessive buffering. Higher bitrates generally correlate with better visual quality but also require more bandwidth.
How to use Average Bitrate metric
- Analyze this metric across different videos and streaming conditions to assess performance consistency.
- Correlate Average Bitrate with viewer feedback regarding streaming quality and buffering experiences.
- Use findings from this metric to optimize encoding settings and bandwidth management strategies.
API usage
Use the List overall values API to retrieve overall values for Average Bitrate. You need to pass average_bitrate as the metricId along with other query parameters to receive the response.
7. Live Stream Latency
Live Stream Latency quantifies the delay between when an event occurs in real life and when viewers see it on their screens during live streaming sessions.
Importance
Understanding Live Stream Latency is essential for assessing real-time engagement during live broadcasts. High latency can negatively impact viewer interaction and satisfaction, particularly in scenarios requiring immediate feedback or participation.
How to use Live Stream Latency metric
- Monitor latency metrics during live events to identify patterns or spikes that may disrupt viewer experiences.
- Analyze feedback from viewers regarding their experience during live streams, especially concerning delays.
- Implement strategies aimed at reducing latency, such as optimizing streaming protocols or server locations, to enhance real-time viewing experiences.
API usage
Use the List overall values API to retrieve overall values for Live Stream Latency. You need to pass live_stream_latency as the metricId along with other query parameters to receive the response