

Analyze viewer drop-off with ClickHouse
Combine FastPix playback and Quality of Experience (QoE) data with your own application telemetry in ClickHouse to find out whether viewers leave because of your content or because of the playback experience.
When you build a video product, one question eventually reaches your desk: why are viewers leaving? At first the cause looks like content — maybe the intro runs long, the topic doesn’t land, or the video isn’t relevant. But after a few investigations, you find that viewers often leave for reasons that have nothing to do with content:
- Playback takes too long to start.
- Video quality drops unexpectedly.
- Buffering interrupts the experience.
- Network conditions degrade playback.
- A specific ISP delivers poor performance.
Most analytics dashboards tell you what happened, but not why it happened. This guide closes that gap. You pull playback and QoE metrics from FastPix, load them into ClickHouse alongside your application telemetry, and run custom queries that separate content problems from delivery problems.
Before you begin
Make sure you have the following in place:
- A FastPix account with Video Data enabled. If you don’t have one yet, sign up at the FastPix dashboard and confirm that Video Data collection is active for your workspace.
- FastPix API credentials. Generate an access token from the FastPix dashboard under Settings > Access Tokens. Each token has two parts: an Access Token ID (used as the username) and a Secret Key (used as the password). You use this pair to authenticate requests to the Video Data APIs. Keep the Secret Key confidential and never commit it to source control. For step-by-step instructions and permission options, see Create an access token.
- A ClickHouse instance. You can use ClickHouse Cloud or a self-hosted deployment. The quickest option is to create a free ClickHouse Cloud service: sign up, verify your email, and let the onboarding wizard create a service in your chosen region.
- Access to run SQL against ClickHouse. This guide uses the ClickHouse Cloud SQL console, but any compatible client works, including
clickhouse-client, DBeaver, or DataGrip. - Permission to create tables in your target ClickHouse database (the default database is fine for this walkthrough).
Open the ClickHouse SQL console
You run every statement in this guide against your ClickHouse service. To open the built-in SQL console in ClickHouse Cloud:
- Log in to
console.clickhouse.cloud. - Select the service you want to work in:
- If you already have a service, select it from the list.
- If you don’t have one yet, create a new service. The onboarding wizard walks you through choosing a region and naming it. For step-by-step instructions, see the ClickHouse Cloud quick start.
- Click Open SQL Console. The console opens in a new tab, connected directly to your service.
If you prefer a command-line workflow, connect with clickhouse-client instead and run the same statements there.
What you’ll build
By the end of this guide, you’ll have a repeatable workflow that joins three data sources and answers a single question: are viewers dropping off because of the content or because of the playback experience?
FastPix Video Data
FastPix captures detailed playback and QoE metrics for every view, including watch time, buffering, startup time, bitrate, playback errors, QoE scores, and network provider information. The Video Data APIs return both raw and aggregated viewer analytics.
ClickHouse
You use ClickHouse to store FastPix metrics, combine them with application data, run custom investigations, and surface patterns that pre-built dashboards hide.
Application telemetry
Most applications also record context about each session. Assume yours collects the following:
Joining this telemetry with FastPix metrics is what lets you connect viewer behavior to application performance.
Pull time-series data from FastPix
FastPix provides a dedicated endpoint for retrieving metrics over time. The response includes three fields — intervalTime, metricValue, and numberOfViews so you can track how a playback metric evolves.
Request any of these metrics over your chosen interval:
- Views
- Watch time
- QoE
- Startup time
- Buffer ratio
Use time-series data when you want to identify trends, find peak engagement periods, and spot playback quality changes over time. For request and response details, see the Get timeseries data API reference.
Call the endpoint with your FastPix credentials and save the response to a file so you can load it into ClickHouse in the next section. FastPix uses HTTP Basic authentication, so pass your Access Token ID as the username and your Secret Key as the password:
This request retrieves the views metric. To pull a different metric, replace views in the path with another metric ID.
The response wraps the intervals in a data array, alongside metadata about the query:
Load the data into ClickHouse
To load the FastPix time-series metrics into ClickHouse, do the following:
- Create a table to hold the metrics:
-
Reshape the API response into JSONEachRow format—one JSON object per line (also called newline-delimited JSON, or NDJSON). ClickHouse expects this format for line-delimited JSON ingestion. Because the FastPix response nests the intervals inside a
dataarray, extract that array into one object per line. For example, withjq:Each line should now look like this:
Note
For
JSONEachRow, ClickHouse skips JSON fields that don’t match a table column (input_format_skip_unknown_fieldsis on by default) and fills columns that are missing from the JSON with their default value. If the FastPix response carries extra fields you don’t need, you can leave them in the file—ClickHouse ignores them. -
Import the file into the table. Choose the method that matches how you access ClickHouse.
Using
clickhouse-clientwith a local file:For a ClickHouse Cloud service, include your connection details:
Or over the HTTP interface with
curl:
Imported FastPix time-series rows in JSONEachRow format, each line containing intervalTime, metricValue, and numberOfViews.
After the data loads, a quick aggregation by hour might look like this:
You can immediately spot the peak viewing period at noon—but you still don’t know why viewers might be leaving. The next steps add the context that explains it.
Add your application data
Alongside the FastPix metrics, you need your own application telemetry. This is the data your product already records about each session, such as API latency, page load time, user tier, and how the viewer arrived.
Before you continue, have your application-level data ready as a spreadsheet (for example, an .xlsx or .csv file) exported from your application or data warehouse. At a minimum, include a timestamp column and the context fields you want to correlate against playback quality:
Upload this file to ClickHouse as a new table. In the ClickHouse Cloud SQL console, use the data-import option to upload the spreadsheet and let ClickHouse infer the column types, or convert the file to CSV and load it with clickhouse-client:
Name the resulting table Appdata so it matches the queries in the sections that follow.
After the data is in place, look for moments where your application was under strain. If API latency jumps and page load time increases during the peak you found after loading the time-series data, that’s exactly the kind of signal that can explain viewer dissatisfaction.
Use FastPix playback data
Your FastPix dataset already contains rich playback metrics. The following columns are the most useful for investigating playback quality directly:
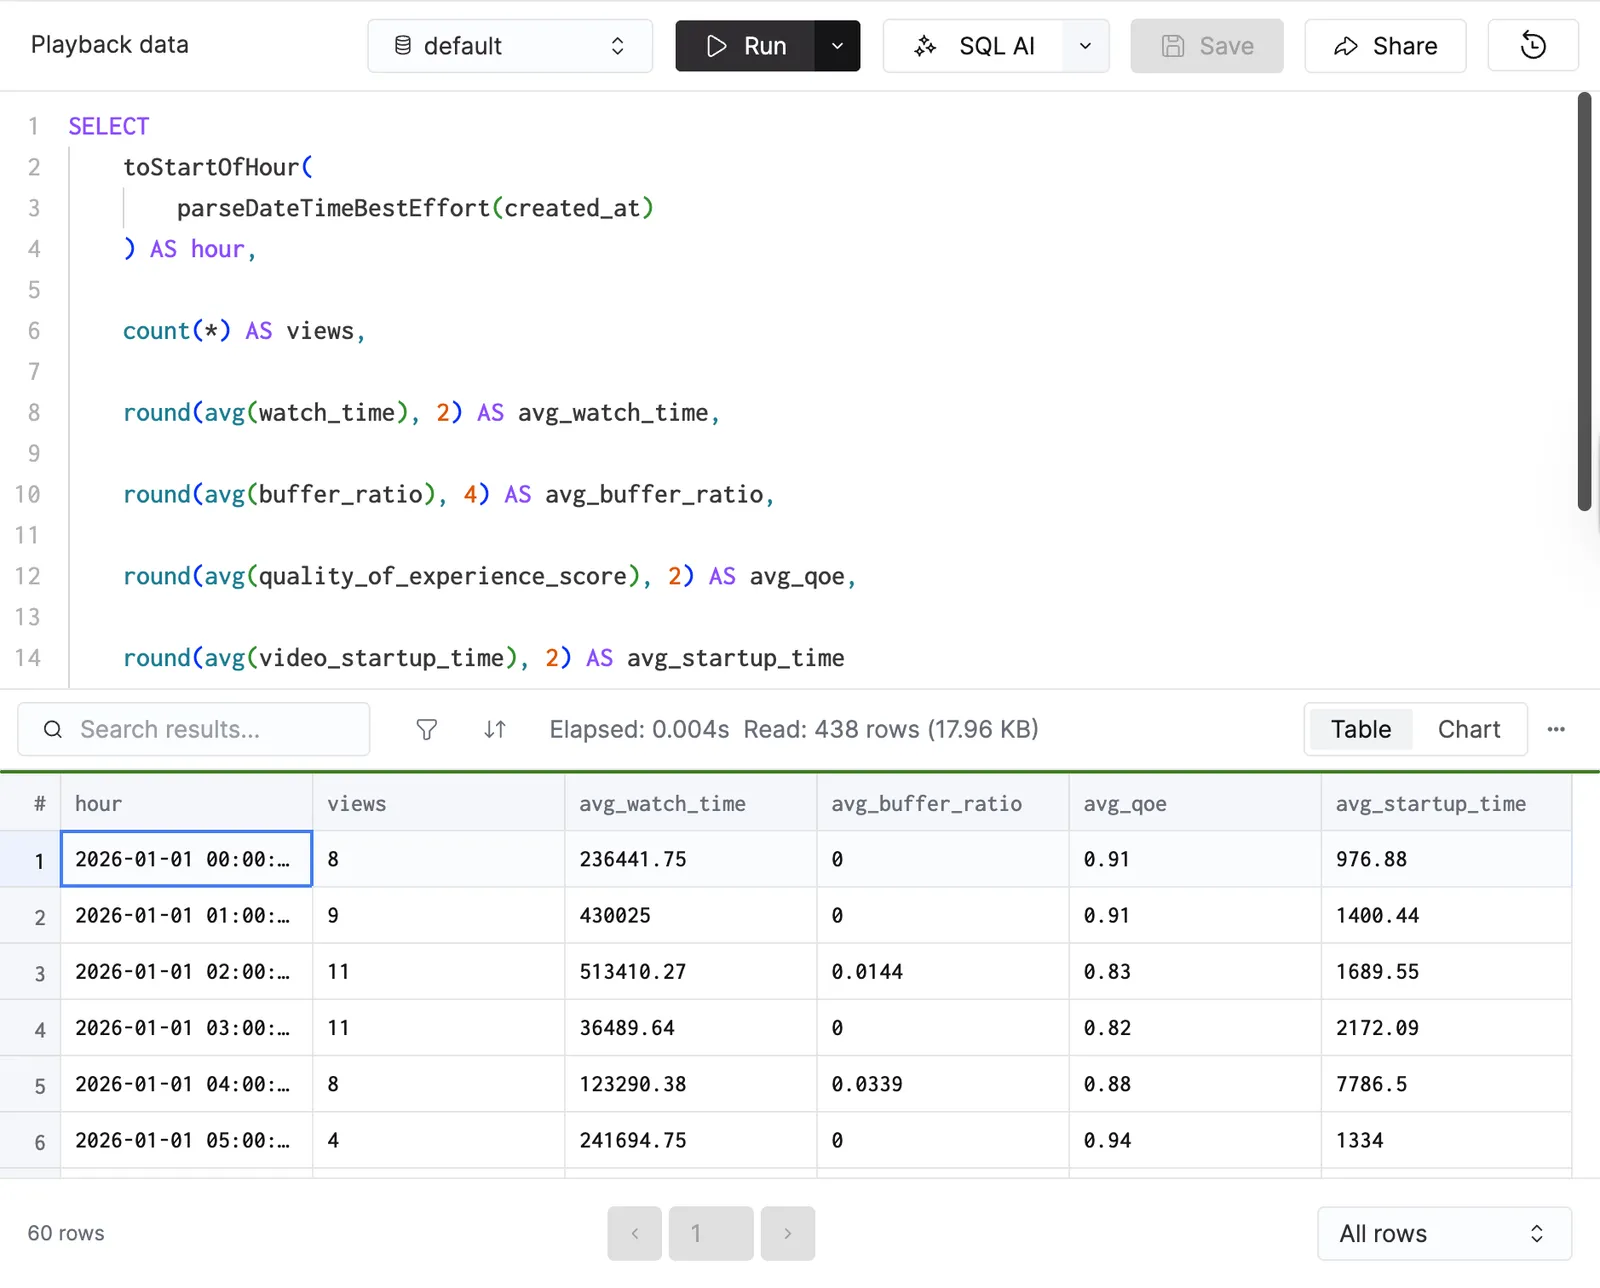
FastPix playback columns queried in the ClickHouse SQL console.
Investigate viewer experience
Start by building an hourly timeline of the core experience metrics. This query groups views by hour and averages watch time, buffering, QoE, and startup time:
The result gives you a timeline of views, watch time, buffering, startup performance, and QoE so you can see what viewers actually experienced hour by hour.
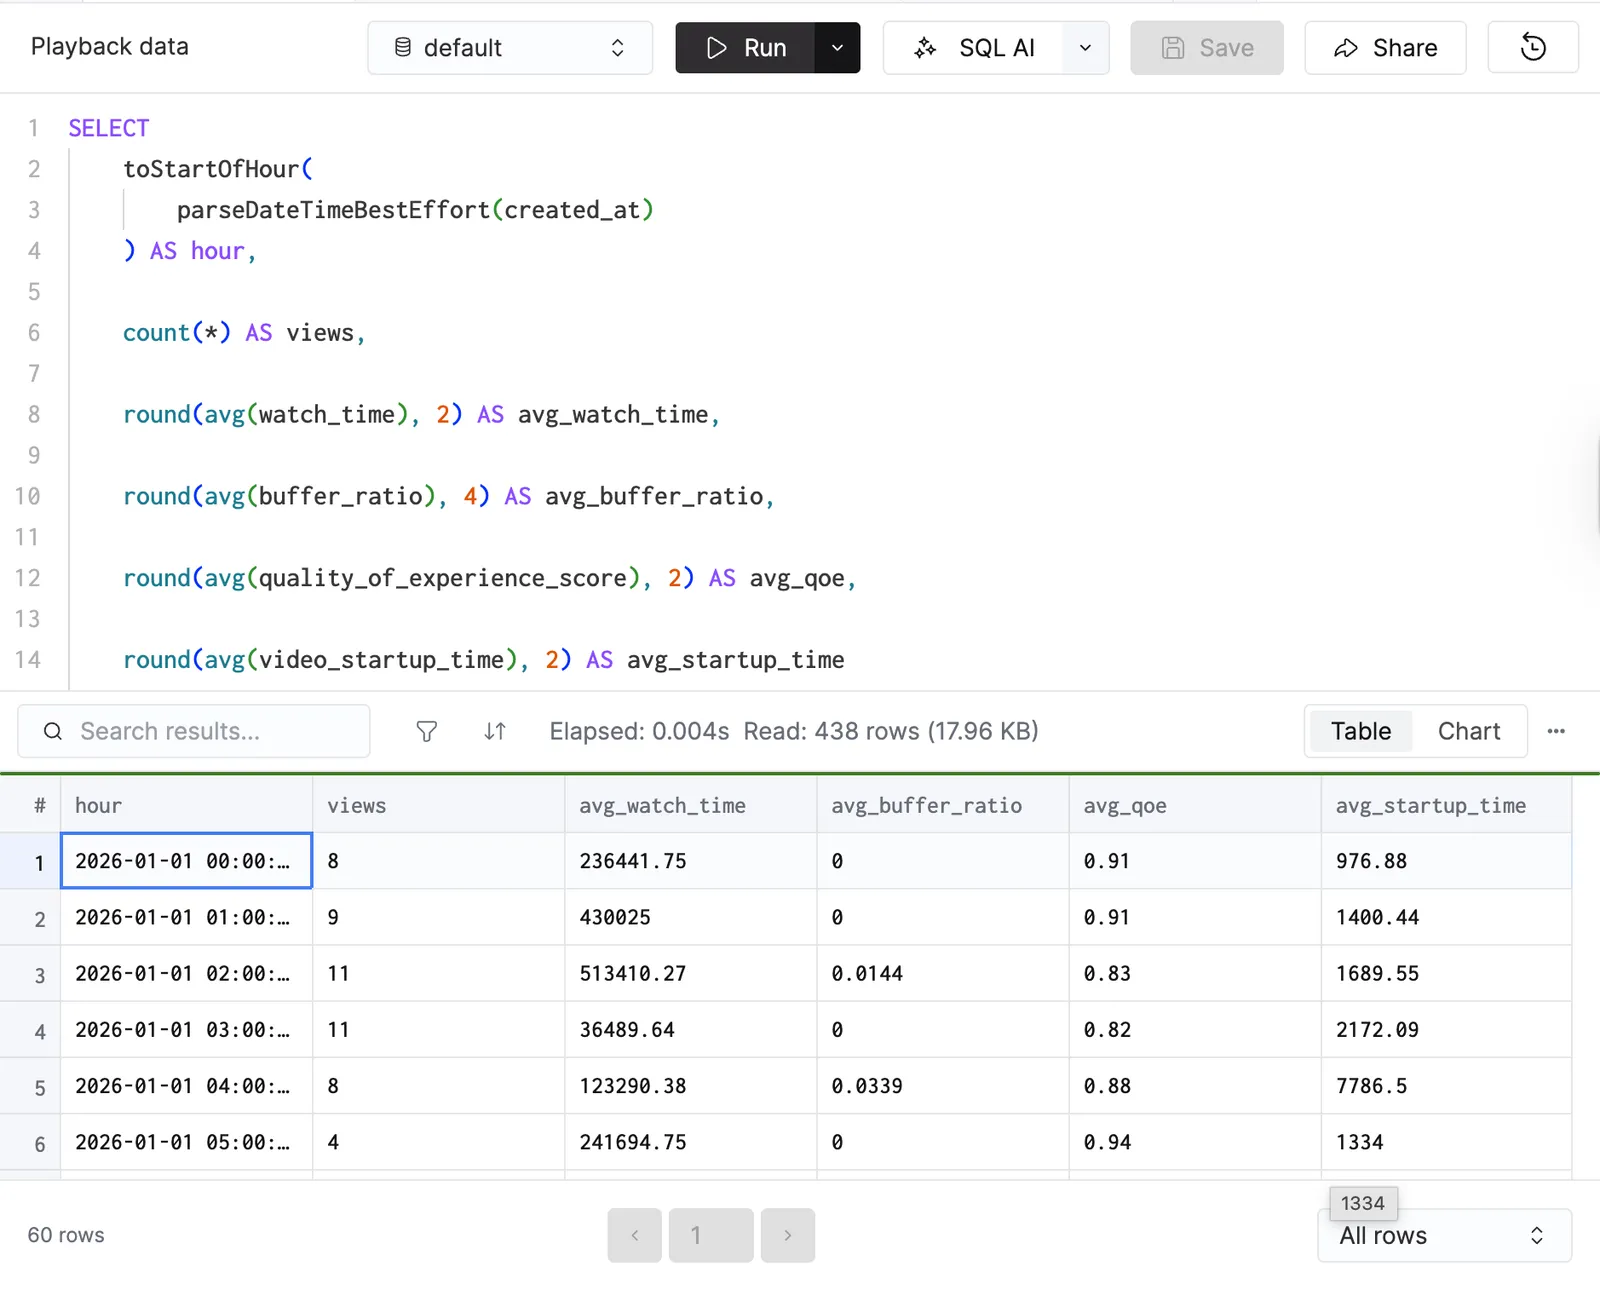
Hourly viewer-experience timeline produced by the query above.
Find network providers causing poor experiences
One of the most valuable dimensions in the FastPix dataset is asn_name, the viewer’s network provider. Grouping by ISP reveals whether a specific network is delivering a worse experience.
The HAVING views > 10 clause filters out low-traffic providers so you compare only ISPs with a meaningful sample:
Are viewers on a particular ISP having a worse experience? Sorting by
avg_qoeascending puts the worst-performing providers at the top. This breakdown is valuable for video engineers, platform teams, and customer success teams investigating regional or provider-specific complaints.

Quality of Experience compared across network providers (ASNs).
Check whether latency affects QoE
Next, compare request latency and playback quality on the same timeline. If QoE drops when latency rises, infrastructure performance rather than content is likely affecting viewers.
Plot the two series together. Where the latency line spikes and the QoE line dips at the same hour, infrastructure is the more likely cause of drop-off.
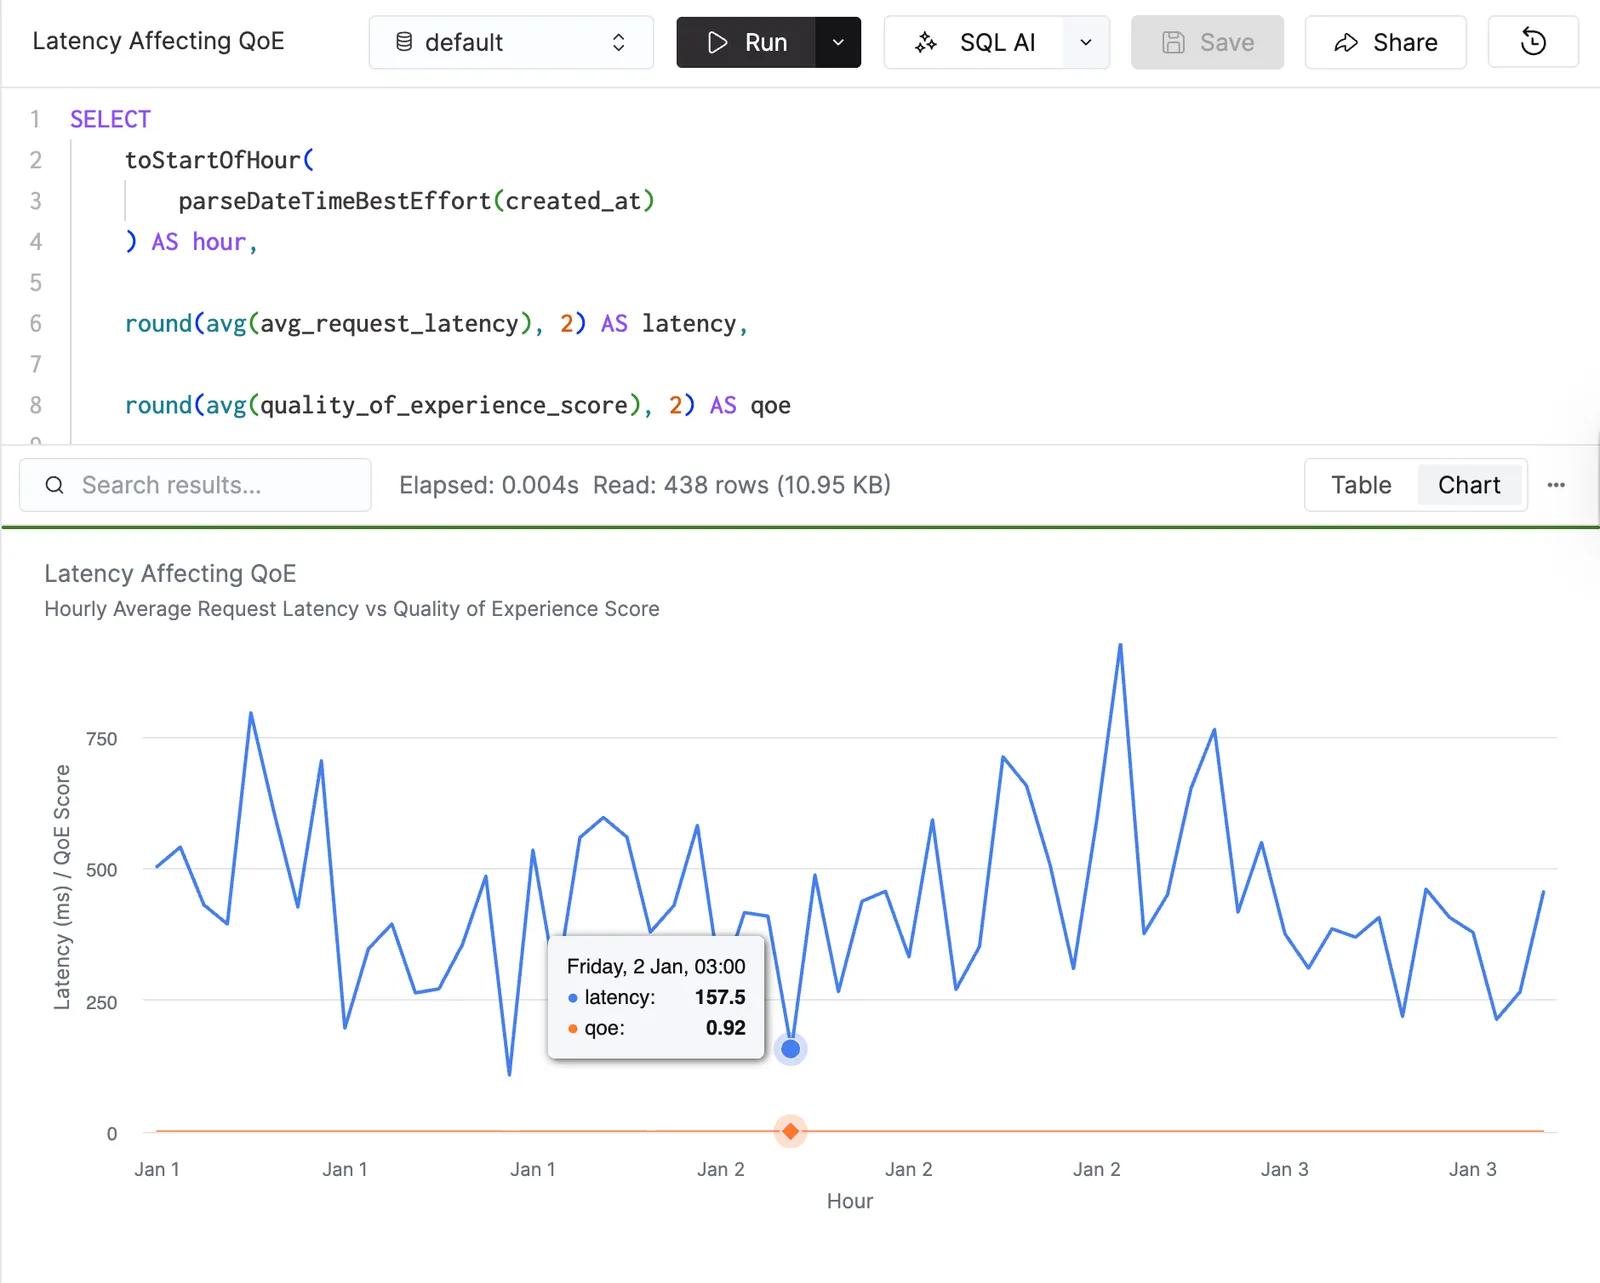
Hourly request latency plotted against QoE score.
Identify videos with potential drop-off problems
Finally, investigate engagement at the individual video level. This query ranks videos by average watch time and surfaces the playback metrics alongside it:
A result set might look like this:
This is where the investigation gets interesting. For Product Demo A, watch time is low, buffering is high, and QoE is poor. Taken together, those signals suggest the problem isn’t the content, the playback experience is likely driving viewers away.
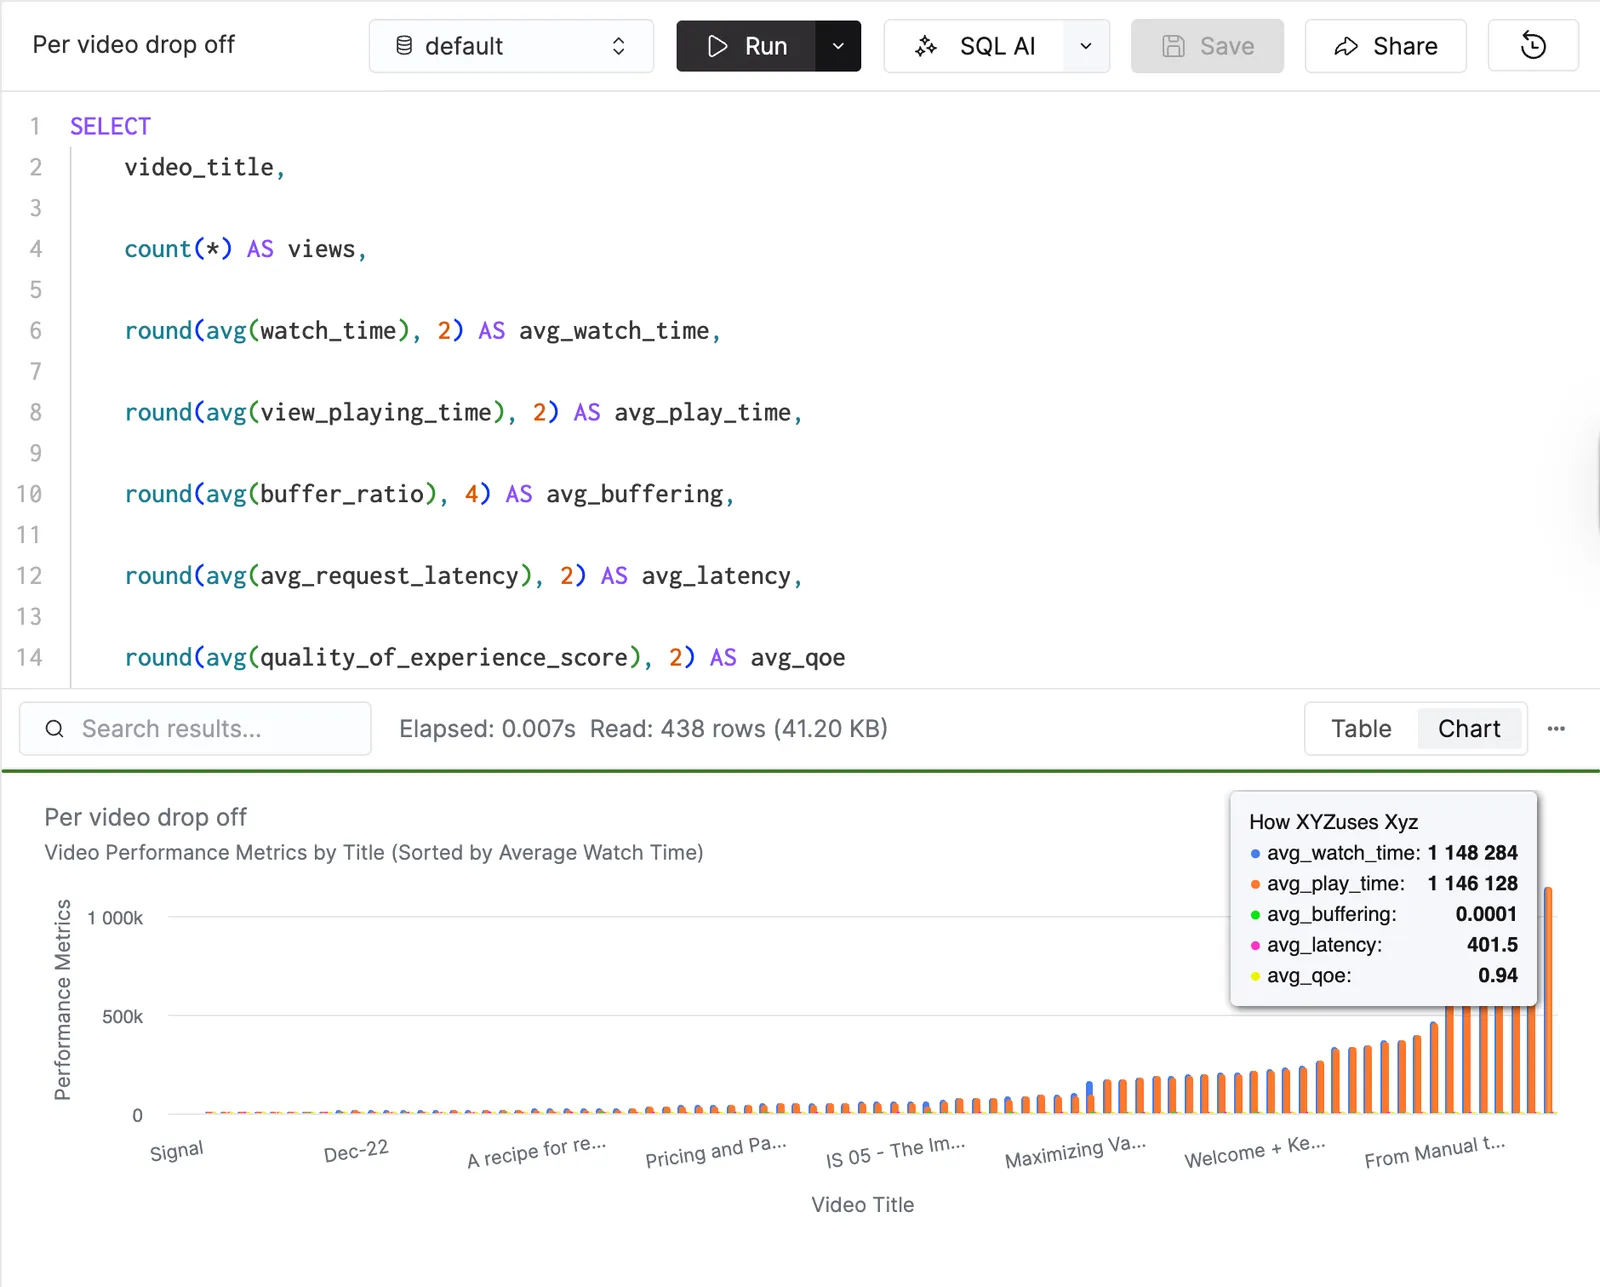
Per-video performance metrics, sorted by average watch time.
When to use FastPix vs. ClickHouse
A common question is why you wouldn’t just use the FastPix dashboard. The answer is that the two tools answer different questions, and they’re strongest together.
FastPix answers what are viewers experiencing? ClickHouse answers why are they experiencing it? Used together, they give you a far more complete picture than either alone.
Summary
Viewer drop-offs are rarely caused by a single factor. A viewer might leave because the content isn’t engaging, startup times are too high, buffering interrupts playback, network conditions degrade quality, or backend latency slows delivery.
FastPix Video Data APIs provide the playback and QoE signals you need to understand viewer experience. ClickHouse gives you the flexibility to investigate deeper and to join video analytics with your application telemetry. Together they move you beyond simple reporting toward answering the question every video team eventually asks: why did viewers leave?
Next steps
Schedule the FastPix time-series export to refresh your ClickHouse tables on a regular interval, then save these queries as views so any team can re-run the drop-off investigation on demand.